

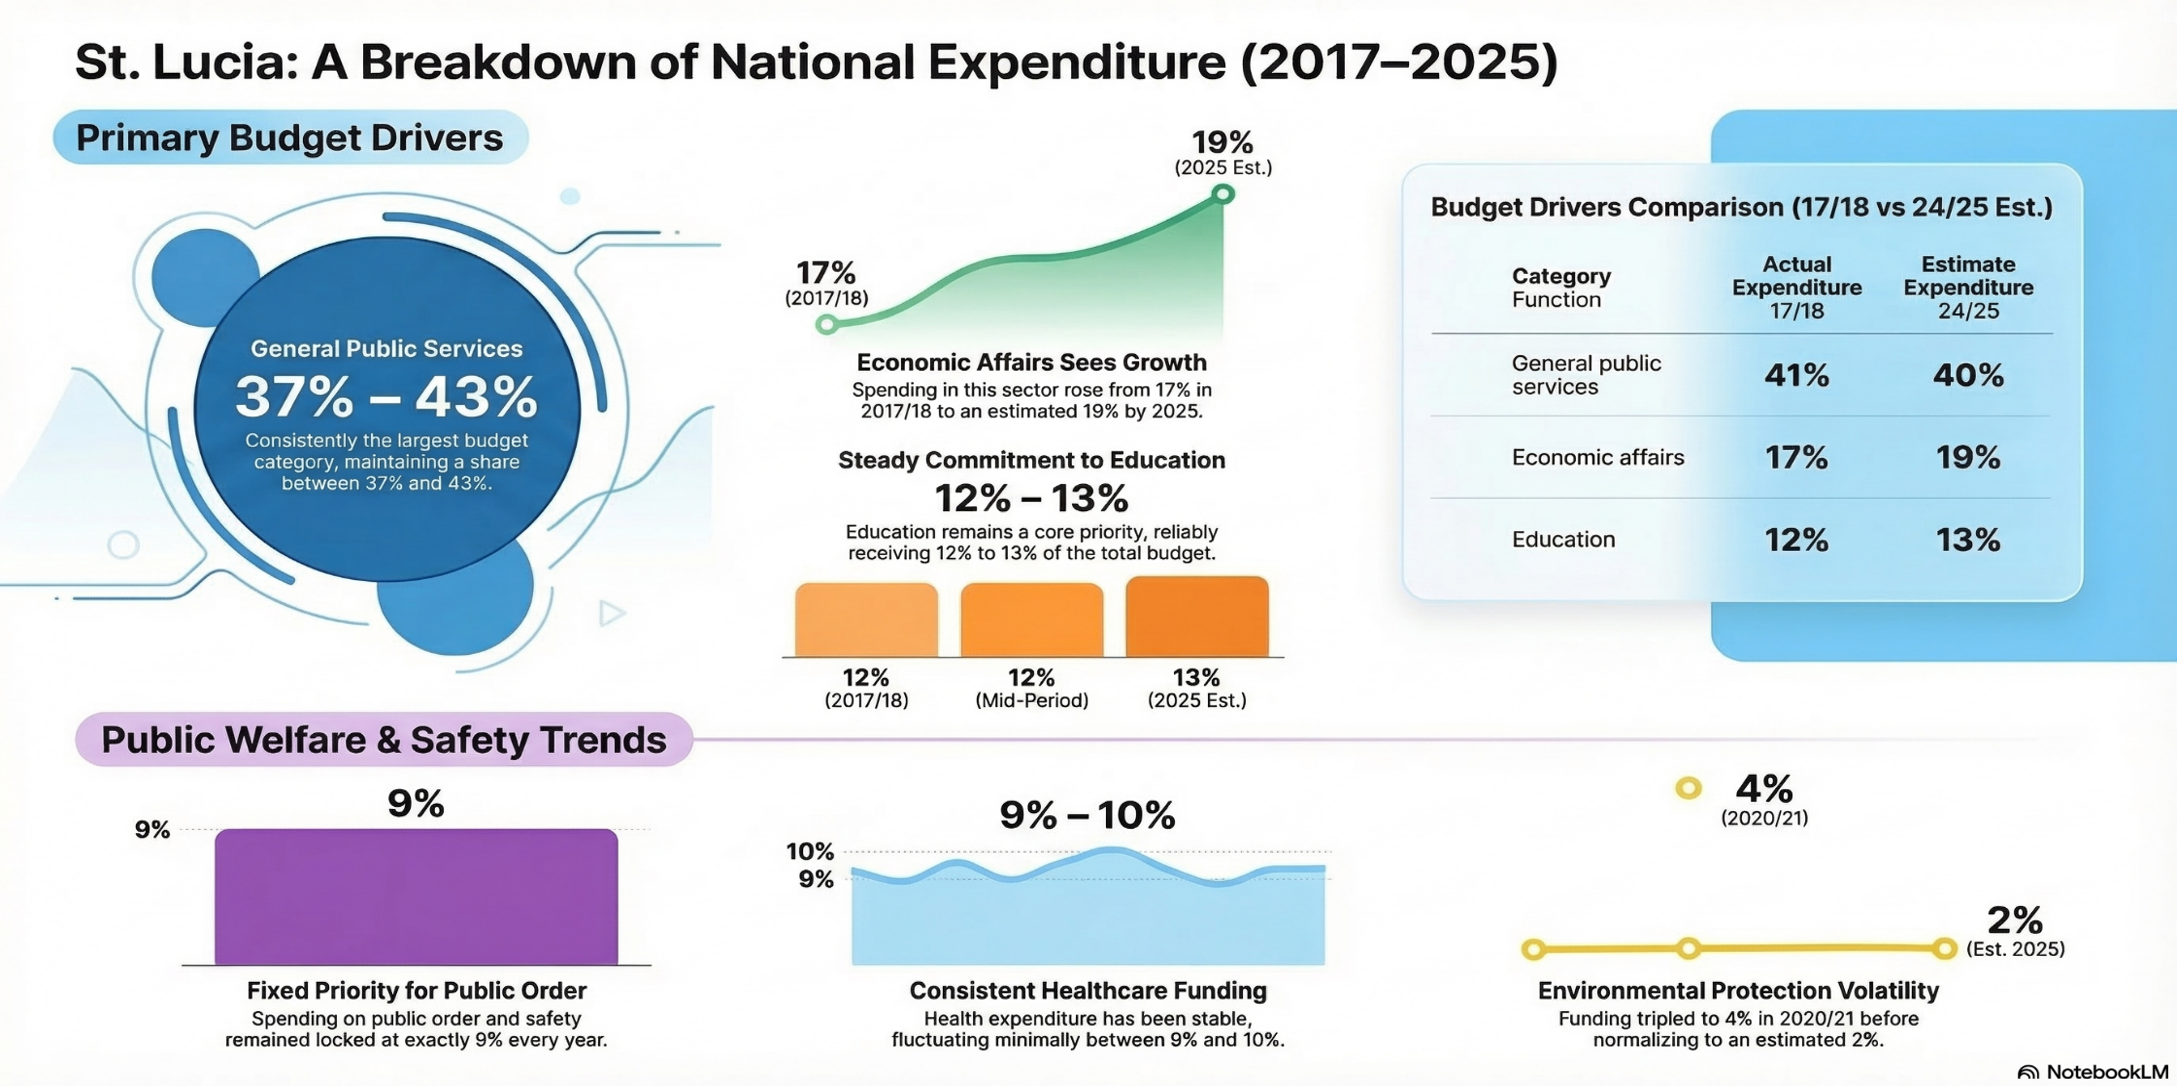
Key Note: Table 4: Government Expenditure by Function (COFOG) as a % of Total Expenditure (Division Level)
The table below provides a detailed breakdown of St. Lucia’s central government spending categorized by function from the 2017/2018 fiscal year through projections for 2024/2025. The figures represent the percentage of total expenditure allocated to various public sectors, such as general public servcices, education, health, and economic affairs. Throughout the recorded period, general public services consistently represent the largest share of the budget, often averaging 40%. Other significant priorities include economic affairs 18%, education 12% and health 10 % respectively, while sectors like defense receive no funding, due to no militia in St.Lucia. The sectors which receive the least funding and may very well be oversighted are environmental protection and social protection both averaging 2% of the total budget. This financial overview, sourced from the Central Statistical Office of Saint Lucia, tracks how the nation prioritizes its resources over nearly a decade. These statistics offer a clear look at the shifting fiscal priorities and stability of the island's domestic investments.
| Central Government Expenditure by function (COFOG) for St. Lucia, 2017/2018 - 2024/2025 (% of Total Expenditure) | |||||||||
|---|---|---|---|---|---|---|---|---|---|
| COFOG Division Code | Category Function | Actual Expenditure 17/18 | Actual Expenditure 18/19 | Actual Expenditure 19/20 | Actual Expenditure 20/21 | Actual Expenditure 21/22 | Actual Expenditure 22/23 | Estimate Expenditure 23/24 | Estimate Expenditure 24/25 |
| 1 | General Public Services | 41% | 43% | 41% | 37% | 38% | 41% | 39% | 40% |
| 2 | Defense | 0% | 0% | 0% | 0% | 0% | 0% | 0% | 0% |
| 3 | Public Order & Safety | 9% | 9% | 9% | 9% | 9% | 9% | 9% | 9% |
| 4 | Economic Affairs | 17% | 16% | 16% | 19% | 18% | 17% | 19% | 19% |
| 5 | Environmental Protection | 1% | 1% | 1% | 4% | 4% | 3% | 2% | 2% |
| 6 | Housing & Community Amenities | 7% | 5% | 5% | 4% | 4% | 4% | 5% | 5% |
| 7 | Health | 9% | 9% | 9% | 10% | 10% | 10% | 10% | 9% |
| 8 | Recreation, Culture, & Religion | 2% | 2% | 3% | 2% | 1% | 1% | 2% | 2% |
| 9 | Education | 12% | 13% | 12% | 12% | 13% | 13% | 12% | 13% |
| 10 | Social Protection | 2% | 2% | 2% | 3% | 2% | 2% | 2% | 2% |
| Total Expenditure | 100% | 100% | 100% | 100% | 100% | 100% | 100% | 100% | |
| Source: Central Statistical Office of Saint Lucia, National Accounts, 3/6/26 |